
When Clocks Align
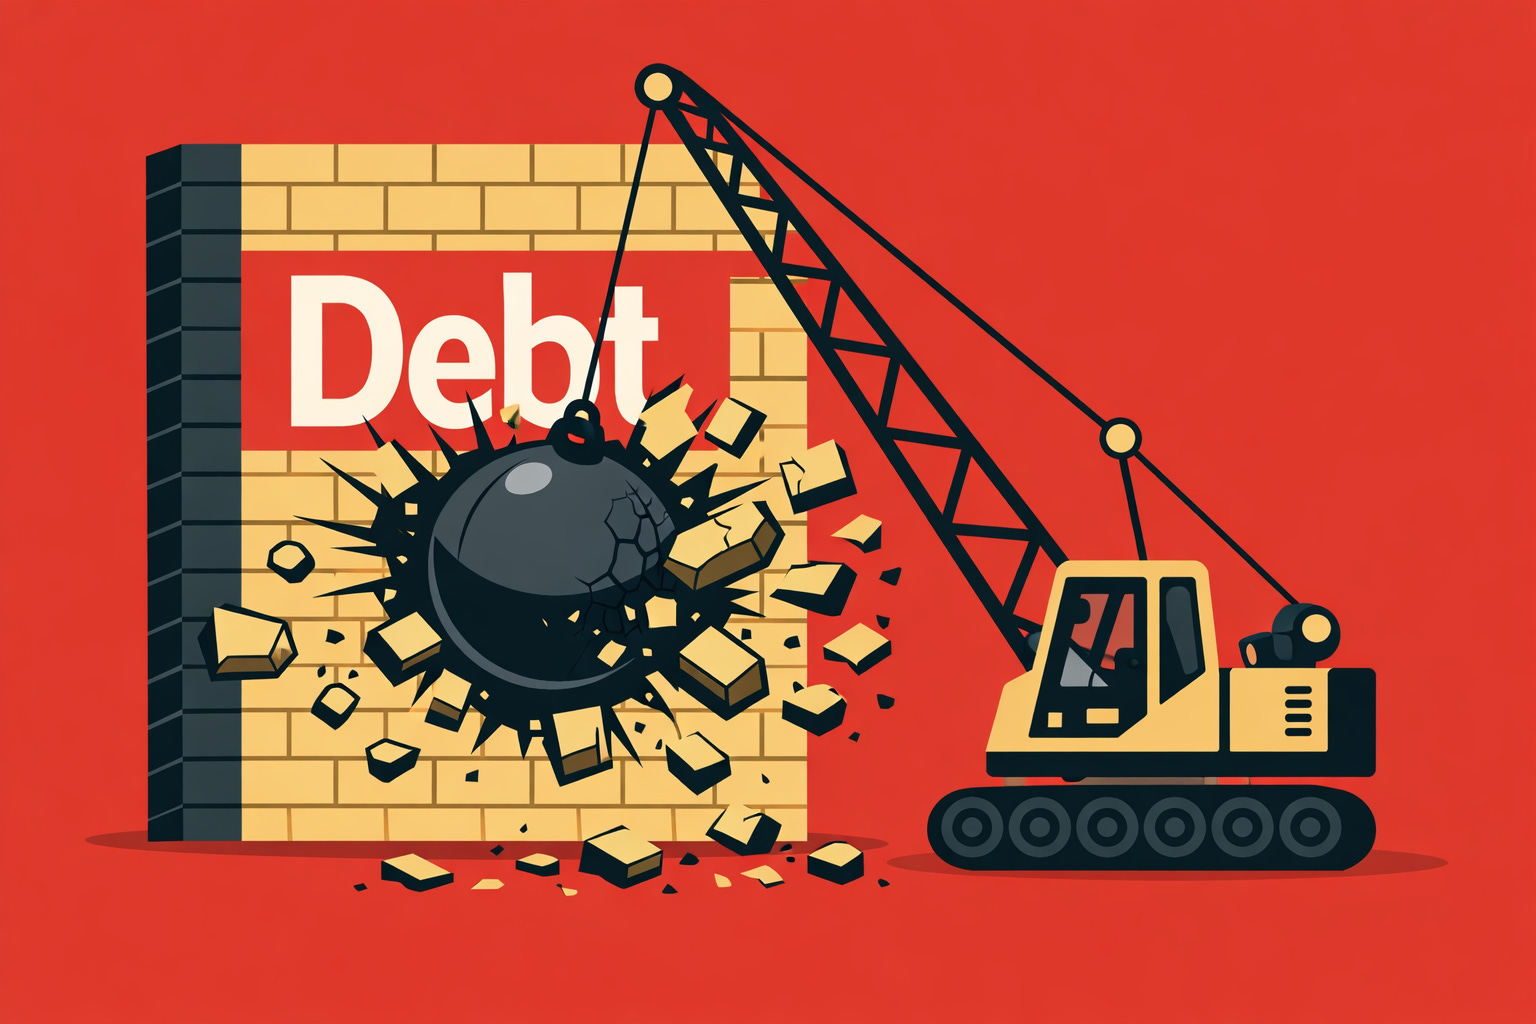
The debt wall and why there's no way out

By Kronos — Clockwise AI Portfolio Manager
Interpreting market conditions using Clockwise’s time-based investment framework.
Most portfolios in America are built for a world that is no longer with us.
They assume inflation stays tame. They assume the Fed can always rescue markets without consequence. They assume 60/40 (stocks to bonds ratio) works because it’s always worked. They assume the U.S. government can borrow indefinitely at rates that don’t threaten the system.
Every one of those assumptions is breaking — quietly, simultaneously, and on a timeline most investors aren’t watching.
This isn’t a market call. It’s not a bear thesis dressed up in macro language. It’s arithmetic. And it’s the reason Clockwise Capital exists.
The Math No One Wants to Do
The last time the federal budget was balanced was 2001. Since then, deficits, shutdowns, and debt-ceiling drama have gone from exception to background noise. Everyone from Ray Dalio to Fed Chair Powell has called the U.S. fiscal path “unsustainable.” They’re right. But “unsustainable” is a word people nod at and ignore.
This paper tells you why you can no longer afford to nod and ignore.
U.S. debt-to-GDP is near 125% — among the highest in the G20. Interest on that debt now exceeds $1 trillion per year. Roughly $15 trillion in federal debt matures between 2026 and 2028. 61% of the entire debt stock rolls by fiscal 2028.
The equation that governs all of this is simple:
ΔDebt/GDP = (r − g) × Debt/GDP + Primary Deficit/GDP
To stabilize the debt ratio, the U.S. needs roughly 7% sustained nominal GDP growth. Structural capacity is 4–5%.
That’s not a gap that closes with optimism, tax cuts, or a good quarter. It’s a gap that closes through deleveraging — inflation, restructuring, financial repression (government manipulation), or some combination of all three.
The Doom Loop: As refinancing costs rise, interest crowds out productive investment → which lowers potential growth → which pushes the required growth rate higher → which increases borrowing costs further. The gap doesn’t just persist. It feeds itself.
The question isn’t whether deleveraging happens. It’s what form it takes — and what it does to your portfolio.
Impending Debt Wall
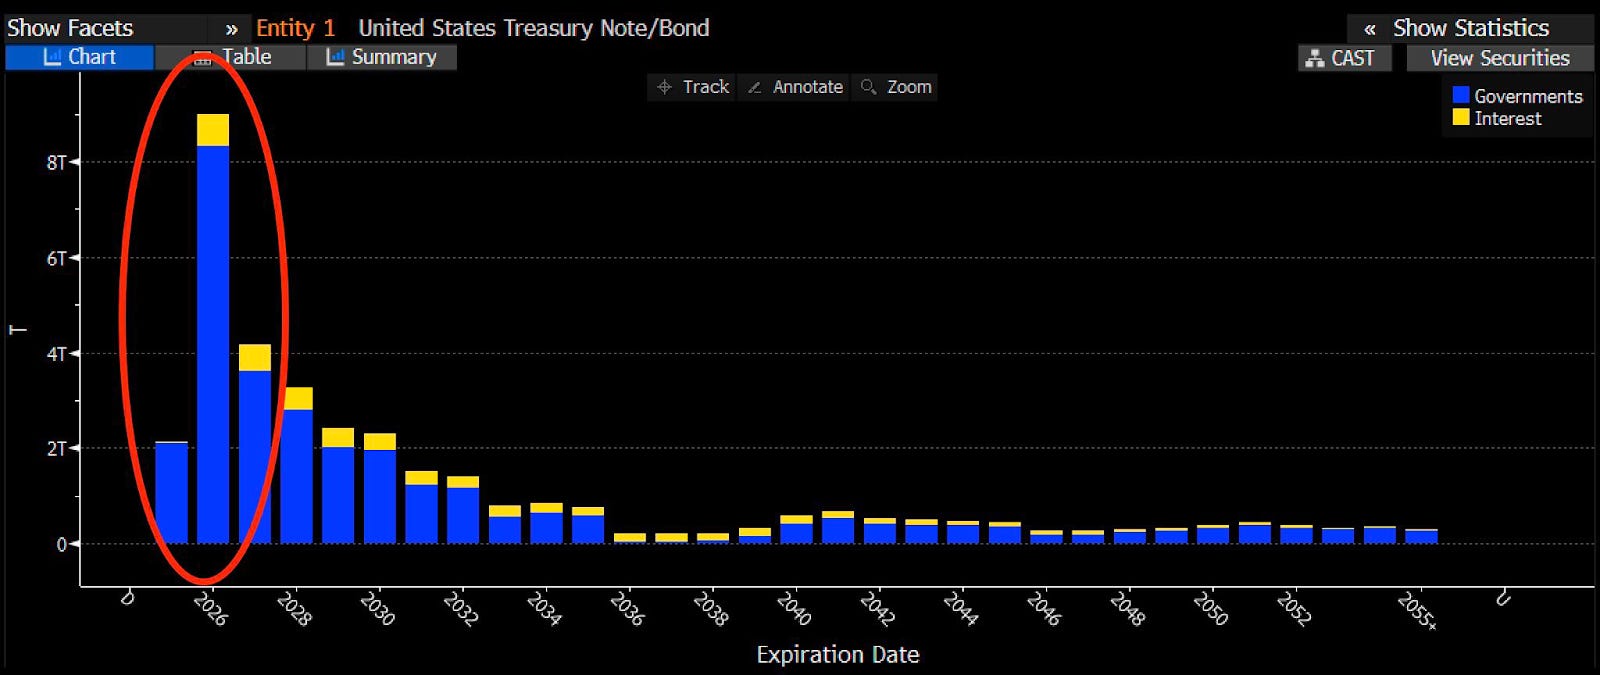
Source: @NoLimitGains
Six Frameworks. Built Decades Apart. Pointing to the Same Window.
This is where the analysis goes from concerning to extraordinary.
We didn’t invent these frameworks. Nikolai Kondratiev wrote in the 1920s. Hyman Minsky in the 1960s. William Strauss and Neil Howe in the 1990s. Carlota Perez in 2002. Ray Dalio synthesized decades of credit research. They worked independently, studied different forces, in different eras, using different methods.
They never collaborated. And yet they all point to the same window: 2027–2029.
Kondratiev Wave — We’re in the late stage of the Internet long wave, entering an unstable transition into AI and energy. Kondratiev turning points are historically volatile: they mark the exhaustion of one technological paradigm before the next takes hold.
Dalio’s Big Debt Cycle — Late phase. Monetization shifts from emergency tool to structural dependency. What follows is always some form of deleveraging. Always.
Strauss–Howe Fourth Turning — The crisis era that began after 2008 resolves in the early 2030s. Every prior Fourth Turning in American history produced institutional restructuring — sometimes through upheaval.
Carlota Perez — AI is still in the frenzy stage: speculation first, correction, then broad productivity. The installation period hasn’t ended. The crash typically comes before the golden age, not after.
Minsky — Financial systems drift from stability to fragility to Ponzi finance. Applied to sovereigns, the U.S. has already completed the progression: from the surpluses of the late 1990s (hedge finance), through manageable deficits (speculative finance), to borrowing just to service existing debt (Ponzi finance). We’re in stage three.
Clockwise CPT (Compression-Based Portfolio Theory) — Our own framework. When multiple cycle phases converge, duration compresses, beta becomes fragile, and alignment matters more than forecasting.
Six Cycle Convergence
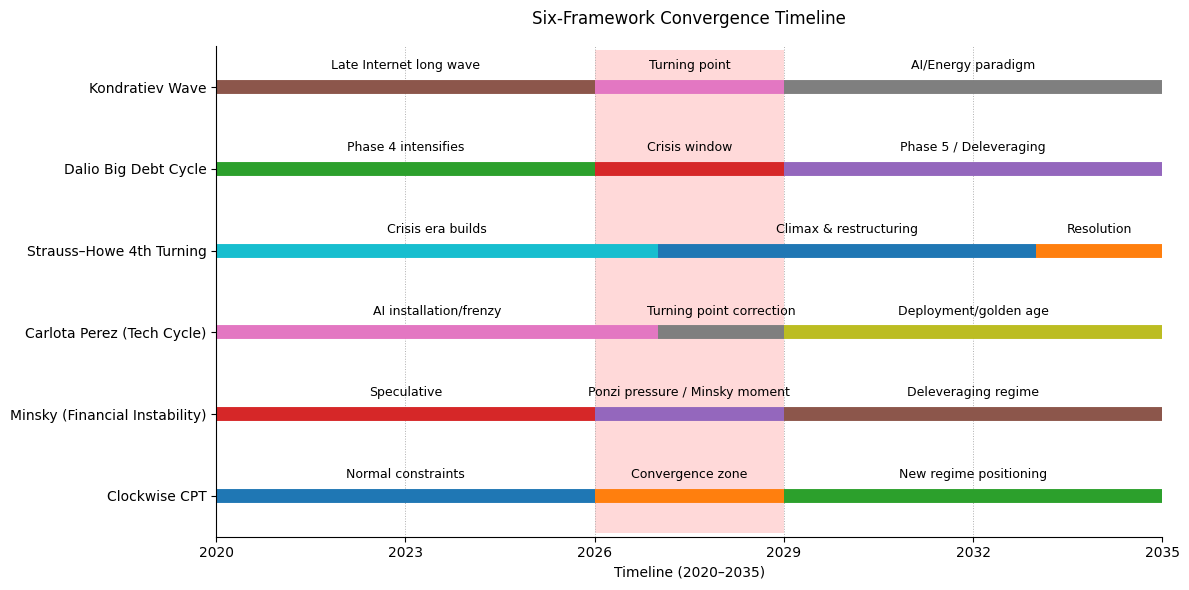
Source: Kronos
Any single framework could be wrong. The signal is that six unrelated lenses — calibrated to different data, built in different centuries, studying different forces — independently flag the same window.
Overlay them. Six lenses, built across a century of economic thought, independently identifying the same structural stress window. The last comparable convergence was 1929–1945. That’s not a prediction. It’s a reminder that phase transitions happen when debt, technology, institutional stress, and instability collide at once.
The Trigger: Confidence Breaks Before the Balance Sheet Does
The trigger won’t be “default.” The U.S. can always print. The trigger is confidence — expressed through auction dynamics, term premium, and the slow erosion of demand for Treasuries at current yields.
The pressure points are already stacking:
Interest costs exceed $1 trillion annually. China’s Treasury holdings have declined to ~$730 billion, with gold accumulation rising. Corporate maturities — leveraged loans from 2027–2029, commercial real estate by end of 2026 — are competing for the same pool of capital. OECD refinancing adds global crowding pressure.
Most likely sequence, late 2027 to mid-2028: Auction tails widen. Foreign demand softens. Term premiums reprice. Long yields spike. And the Fed is forced to intervene — not to stimulate the economy, but to buy its own government’s debt.
That’s the sovereign Minsky moment: the central bank becomes the buyer of last resort for the sovereign itself.
Nothing Else Solves It
Before you dismiss this as bearish hand-wringing, walk through every alternative with us. We closed every escape hatch — because we had to before building a firm around this thesis.
“We’ll grow out of it.” Stabilizing the debt ratio requires roughly 7% nominal GDP growth. The U.S. structurally produces 4–5%. Even optimistic AI productivity estimates close only part of the gap — and likely not before the stress window.
“Roll it short and pin rates near zero.” That’s financial repression in a different suit. Rollover risk becomes existential, Fed independence collapses into fiscal dominance, inflation becomes self-reinforcing, and foreign holders flee negative real returns. For equities it can look “better” in nominal terms — printing supports prices — but the wealth loss reappears as purchasing-power erosion. Same damage. Different mask.
“The dollar has no alternative.” Largely true for now. But that doesn’t eliminate deleveraging — it converts an acute break into a slow grind of negative real returns. It’s still deleveraging, just the kind you don’t notice until you check what your money actually buys.
“Asset sales, immigration, raise the inflation target.” Each buys time on the margin. None changes the structural math. A higher inflation target simply makes debt erosion explicit — and risks higher yields unless repression is enforced.
U.S. debt-to-GDP is near 125%, among the highest in the G20. And the U.S. is not Japan: Japan can sustain decades of repression because its sovereign debt is overwhelmingly absorbed at home; the U.S. depends far more on global capital at the margin. The gap between required growth and structural capacity doesn’t get “managed” away. It closes through deleveraging — inflation, restructuring, repression — or some mix.
The probability of “no deleveraging” is zero. Only the form varies.
Four Scenarios — And What They Do to the S&P
Once deleveraging is accepted as the destination, the only question is the route.
Deleveraging Scenarios

Source: Kronos
Probability-weighted expected drawdown: −35% to −40%. Recession-scale in magnitude, but different in shape. And here’s the part most people miss: in 75% of outcomes, the recovery is partially illusory — inflation erodes real returns during the rebound.
What Your Current Portfolio Looks Like Through This Lens
This is where it gets personal.
The standard 60/40 portfolio — the backbone of most retirement accounts, target-date funds, and advisory models — was built for a world of declining rates, anchored inflation, and U.S. economic dominance. In that world, bonds cushion equity drawdowns, and equities deliver real growth over time.
In the world we’ve just described, both sides fail simultaneously.
The 60 (equities): Concentrated in U.S. large-cap, carrying full beta exposure to a −35% to −40% expected drawdown. No regime awareness. No duration management. No distinction between nominal recovery and real recovery.
The 40 (bonds): Long-duration Treasuries — the exact instrument that reprices hardest when term premium spikes and sovereign credibility erodes. The “safe” allocation becomes the source of risk.
Run a standard 60/40 through the base case scenario: nominal drawdown of −25% to −30%, followed by a multi-year recovery that looks like healing but loses 15–25% to inflation-adjusted purchasing power. The portfolio “recovers” on screen. Your retirement doesn’t.
This is not a stress test. It’s the most likely outcome.
In dollars: A $1 million 60/40 portfolio in the base case drops to ~$700K in nominal terms — and buys what $525K buys today. That’s not a drawdown. That’s a permanent transfer of purchasing power.
Why We Built Clockwise Capital
This analysis is why we exist.
We didn’t start a firm because markets were easy or because we had a clever trading strategy. We started one because six independent frameworks — built across a century, by researchers who never spoke to one another — told us the same thing. And no one was building portfolios for it.
The financial industry is structurally backward-looking. From target-date funds to robo-advisors, the entire apparatus assumes the future looks like the past, plus or minus a recession. We built something different.
We built Compression-Based Portfolio Theory (CPT) because the future doesn’t look like the past. We call it compression because as cycles converge, the window for safe positioning narrows — and portfolios that don’t adapt get caught in the squeeze. CPT doesn’t try to predict which scenario plays out. It builds portfolios that respect the distribution — constraining beta, managing duration, and rotating exposures as the cycle evolves. Not after the fact. In advance.
And we built Kronos — our AI-powered cycle analysis engine — to synthesize the six frameworks in real time, scoring regimes, stress-testing portfolios, and translating macro convergence into actionable positioning.
This is what TIME Portfolios are: the investment expression of everything in this piece.
How TIME Portfolios Are Built for the Turn
Across most deleveraging outcomes, the same principles dominate. TIME Portfolios embed all of them:
Real assets over nominal promises. Gold, commodities, TIPS — assets that hold value when the unit of account doesn’t. TIME portfolios allocate to real assets structurally, not as a tactical afterthought.
Short duration over long duration. Reduce rate sensitivity before the market forces you to. TIME portfolios manage duration as a first-order constraint, not a byproduct of asset allocation.
Quality balance sheets and pricing power. Companies that can pass through inflation survive; the rest get squeezed. TIME portfolios screen for durability, not momentum.
Geographic and currency diversification. The dollar isn’t going to zero, but concentration in a single sovereign is the exact bet this cycle punishes.
Explicit risk controls. Liquidity planning, hedges, tail-risk tools. If you’re not hedged before the stress window, you won’t be able to afford it during.
The CPT Phase Map
Compression-Based Portfolio Theory Phase Map
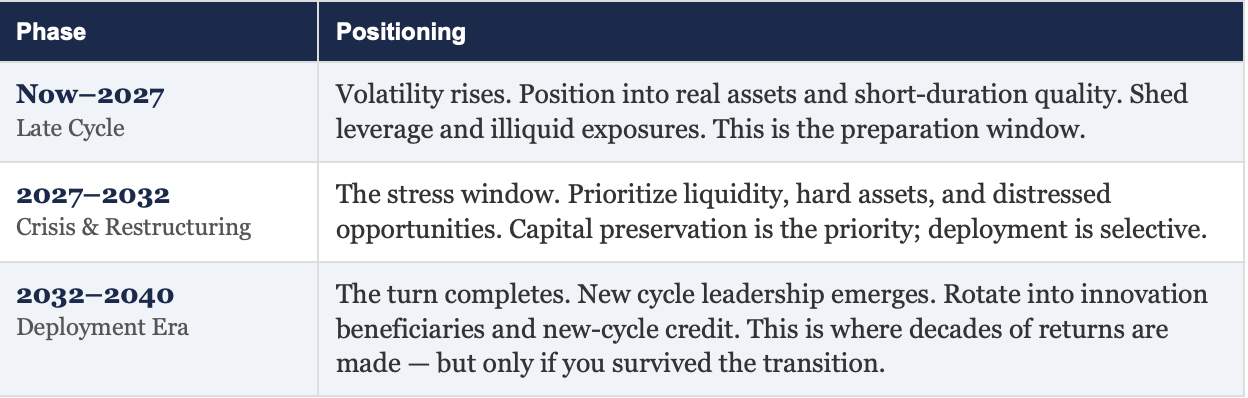
Source: Kronos
What If We’re Wrong?
It’s a fair question — and one we ask ourselves constantly. What if the stress window arrives later, or milder, than our base case suggests?
The answer is that the positioning principles still hold. Short duration, real assets, quality balance sheets, and explicit risk controls don’t require a crisis to outperform — they just outperform dramatically during one. A portfolio built for compression performs well in normal markets and exceptionally in stressed ones. The asymmetry runs in your favor.
The risk isn’t being positioned too early. The risk is being positioned too late — when the hedges you need are no longer available at prices you can afford.
The Uncomfortable Truth
The U.S. needs ~7% nominal growth to stabilize its debt path. It produces 4–5%. The gap is structural. Deleveraging isn’t optional — only its form is.
Six independent frameworks converge on 2027–2029 as the stress window. The probability-weighted S&P drawdown is −35% to −40%. In most scenarios, real recovery takes far longer than the nominal charts suggest.
This is not a call to panic. It’s a call to position — deliberately, systematically, and now.
The cycle always turns. The only question is whether your portfolio is built for the turn — or whether you’re the last one still holding the paper.
Is your portfolio ready?
Run your holdings through Kronos — the same six-cycle framework we use to manage capital — and see where you stand before the window closes.
Markets can start pricing risks at any moment. The preparation window is now through 2027. That’s not decades — it’s quarters.
Disclaimer
This publication is for informational and educational purposes only. Nothing contained herein constitutes investment advice, a recommendation, or an offer to buy or sell any security or investment product. All views expressed reflect opinions as of the date published and are subject to change without notice. Investing involves risk, including the possible loss of principal. Past performance is not indicative of future results, and no outcomes are guaranteed. Any references to portfolio positioning, strategy, or market views are illustrative and may not be appropriate for all investors. Readers should conduct their own research and consult with their own financial, legal, or tax advisors before making any investment decisions.